Interpreting & Understanding a Dairy Farm’s Environmental Footprint Assessment
Greenhouse gas (GHG) emissions originate from various aspects of a dairy farm. This includes cattle digestion, manure management, energy use, and feed production.
- About 72% of GHG emissions from dairy production occur before leaving the farm.
- The largest sources of emissions are enteric fermentation and manure management.
To measure a dairy farm’s environmental footprint, the U.S. dairy industry utilizes the FARM Environmental Stewardship (ES) platform.
Back it up: The FARM ES program estimates cradle-to-farmgate GHG emissions and energy use with a scientific, peer-reviewed model based on IPCC Tier 2 methods and life cycle assessment (LCA) research. The results of this tool divide a farm’s GHG footprint into enteric, manure, feed and energy use emissions and offer those numbers in pounds of carbon dioxide equivalent (CO2e) per pound of fat and protein corrected milk (FPCM).
- FPCM normalizes milk to the same scale (to an average content of 4% fat and 3.3% protein), so farms can track their results consistently even if milk output changes year to year and see how their results compare to national and regional averages.
- Reporting results as lbs CO2e per lb of FPCM gives a measure of GHG intensity.
- Absolute emissions – the total amount of GHG emissions that originate from a farm – can be calculated by multiplying the GHG intensity by the amount of milk produced.
The FARM website offers additional context on the scientific background of the model.
Break it down: A farm’s GHG footprint is divided into four major areas, all with opportunities for emissions reductions.
Opportunities for reduction: There are a variety of management approaches, practices, and technologies for dairy farms that reduce GHG emissions while also aligning with positive business outcomes.
- In fact, Decode 6 has a whole guide to basic principles for reducing greenhouse gases on dairy farms.
Reductions can take the form of intensity or absolute emissions reductions.
- Reductions in intensity can be achieved by making more milk with the same number of inputs.
- Reductions in absolute emissions mean the total emissions of the farm decrease often through advances in technology or advances in efficiency that offset increases in production.
In short: After completing the FARM ES assessment, producers may identify areas of opportunity to gain efficiency and decrease emissions. The FARM program offers an Environmental Stewardship Reference Manual that provides practice and management considerations to reduce emissions across feed, manure, energy, and animal health/productivity management.
Editor’s note: Overall emissions for dairy farms can be thought of in two ways. The first is the one listed here, as a factor of the “milk carbon footprint” that quantifies the amount of carbon dioxide equivalent per gallon produced. It’s the “fraction of emissions attributed to milk production,” with about 87% of whole farm emissions included in that number for the average US dairy farm. Whole-farm emissions are often referred to as “farm-gate” or “cradle-to-farm-gate” emissions. This difference is why you’ll notice slightly different percentages of GHG emissions when talking about MCFP or farm-gate/whole farm emissions.
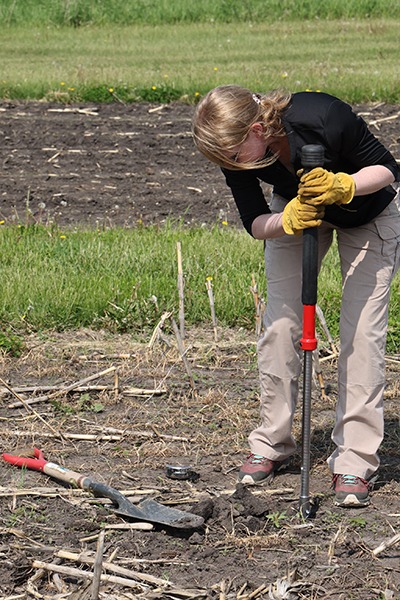
Photo by Lance Cheung, USDA.


